The Spaceguard survey: Discovery statistics at the end of 2003
Published on Saturday 20 December 2003
The NASA Spaceguard survey is officially a 10 years program aimed at discovering 90% of the 1km sized Near Earth Objects. This size threshold was taken because it is estimated to be the smallest size of object able to produce global consequences on Earth (i.e. not only around the impact zone or continent). While some other groups have a some activity in the domain of discovery of Near Earth Objects, 87.5% of discoveries in the recent years has been by north american programs funded by NASA. If we include all the north american discoveries (including before Spaceguard times, as well as amateur discoveries), we reach 2453 or 94.3% of the Near Earth Objects discoveries. Rest of the world 5.6%, no comment.
The Spaceguard survey was started in 1998. There is no real agreement on the exact start date. I thought it was started officially at the beginning of 1998 (so end of 2002 was the midway point), but Brian Marsden pointed out to me that the project was presented to the US Congress on May 21, and everybody I talked to so far agrees that the aim is to finish the survey in its current form at the end of 2008. So Spaceguard is a 10.5 years +/-0.5 years. A symbolic date, closer to a 10 years duration could be June 30th 1908, i.e. The 100th anniversary of the Tunguska fall in Siberia. Whatever date it may be, whatever the goal reached (i.e. 90% of the 1km NEAs or less), the Spaceguard survey will stay in astronomical history as a landmark program for at least two good reasons : It has created a revolution in minor planet science, and it is the first time humanity take a positive attitude toward possible collision between the Earth and an asteroid.
The data : in the first week of January 2004, like I had done last year at the same time, I uploaded 3 files from the Minor Planet Center web site, i.e. the Amor, Apollo and Aten files, kept only the useful data (i.e. removed the headers and footers of the page, juste keeping the numerical data), removed the few objects already discovered in 2004, then merged them in a large text file, which I later used in Excel and Kaleidagraph (another data processing software available for both PC and Macintoshes). For an interesting comparison, you could look at the same page, made a year ago
Some important definitions :
- Apparent magnitude is a measure of the apparent brightness of a given star, and in this context asteroid. It depends of the object size, its albedo (coefficient of reflection of the light), its distance to the sun and to the Earth.
- Absolute magnitude is the magnitude that an asteroid would have if located at the distance of one astronomical unit (AU) of the sun (i.e. the distance of the Earth to the Sun, i.e. roughly speaking 150 millions km) and one AU from the Earth. This measures allow to compare asteroids between each other, whereas the apparent magnitude of a given asteroid varies with its position on its orbit versus the position of the Earth.
- In all this data, I rounded the published absolute magnitudes by taking the integer part of the magnitude (i.e. 16 for any object between 16.00 and 16.99). Therefore, in this data, and this is an important point to understand, all objects brighter than absolute magnitude 18 are published here as objects of magnitude 17. This is important in order to be able to compare with other publications made in particular by NASA.I tried to point out also when the data was by individual magnitude class (i.e. all objects between magnitude 17 and 18, noted magnitude 17) and when it was refering to cumulative magnitude (i.e. all objects brighter than magnitude 18, i.e. from the brightest, to magnitude 17.99 )
- I will not explain what Apollo, Aten and Amor mean, nor basic orbital elements signification.
Statistics of discovery :
Number of objects and length of arc.
At the end of 2003, there were 2600 individual objects, including 339 numbered Near Earth Asteroids (i.e. with good quality orbits), 736 asteroids which had been observed at two or more oppositions (i.e. low quality but meaningful orbital elements), and the rest (1525 objects) which had been seen only during one opposition, i.e. having low to very low quality orbital elements, having been observed between 383 days down to 0 days. In these 2600 objects, there are 1171 Amor asteroids, 1226 Apollo asteroids and 203 Aten asteroids. During 2003, there were 437 discoveries of NEOs, i.e. more than one per day. 185 Amors, 220 Apollos and 35 Atens were discovered this year.
The following graph give the same information :
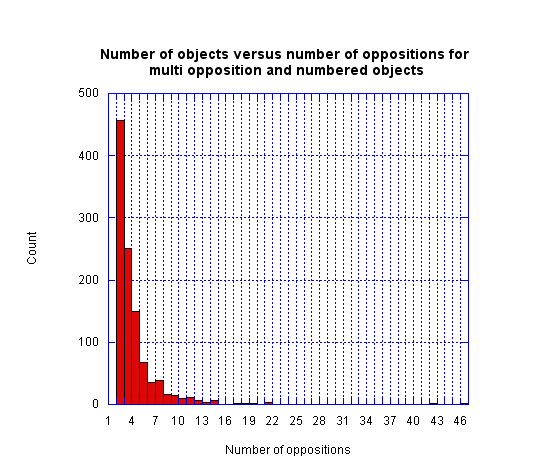
Here is the distribution for 2 or more oppositions objects : These contains both the objects which are numbered (i.e. good quality orbital data) and objects whose orbits, while not good enough to be numbered, are relatively good, and should be easy to recover during their next opposition.
Here is the distribution for one opposition objects: distribution of the observed arc, i.e. the number of day between the first and the last night of observation.
Typically an object with an arc shorter than one month will be rediscovered later, and identified with the former object only when the second opposition arc becomes larger. Such a short arc is usually almost worthless in providing information to attempt a recovery a few years later. However, it must be said that a ten days arc is in the vast majority of cases enough to make sure that the object will not collide with the Earth in the coming century. And as a reverse proposition, the orbits of such an object is so uncertain that if the object makes a close approach to Earth in the future, its large error ellipse can include the Earth giving a temporary low probability of impact with the Earth, which usually vanishes as soon as more observations are collected. So the fact that the majority of objects have short arcs is not a big problem considering that we can derive if the object could be dangerous or not relatively quickly. In the other case (potentially dangerous object), one should turn his diskette 7 times in the computer before making any sensational announcements....
Discoverers :
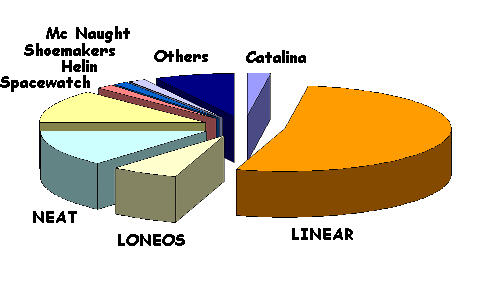
As far as the discoveries, most of them have been done by the LINEAR program, which started observing in 1998. Second comes the pioneer of all these programs, i.e. Spacewatch, with JPL's NEAT following, then Lowell Observatory's LONEOS program and the apparently stopped Catalina Sky Survey. 309 discoveries were credited to all other discoverers, except a few individuals who have done a large contribution, like Carolyn and Gene Shoemakers and the many different helpers, Eleanor Helin and her helpers at the time of Palomar, and Robert Mc Naught et al at Siding Spring Observatory, at the time when Australia had a southern hemisphere discovery program.
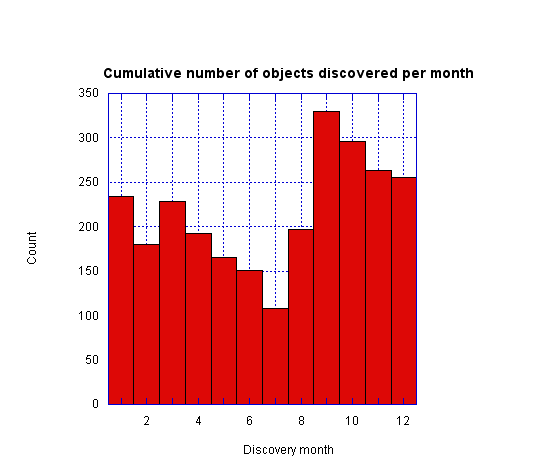
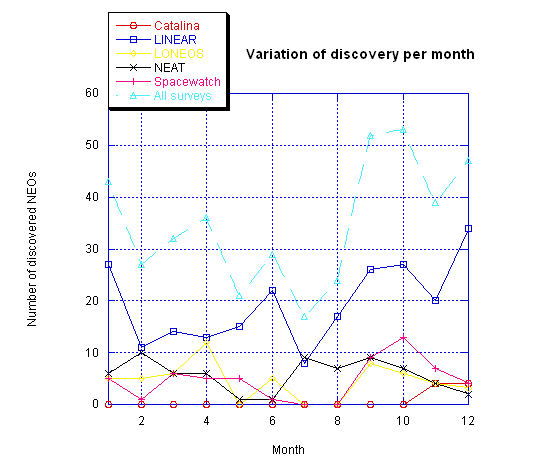
Another interesting discovery statistic is the distribution of discoveries versus the month of the year :
There is more than a factor of 3 between the number of discoveries made in July and September. The drop of discoveries in July and also August is caused by the generally poor weather in New Mexico and Arizona during these monthes. The surge in September can be explained by the fact that a substantial portion of objects "missed" in the summer are caught later. It would be important to check this by looking at individual objects discovered in September (to see if they were already visible/"discoverable" during july and august), but it is a likely explanation.
Evolution of discoveries with time.
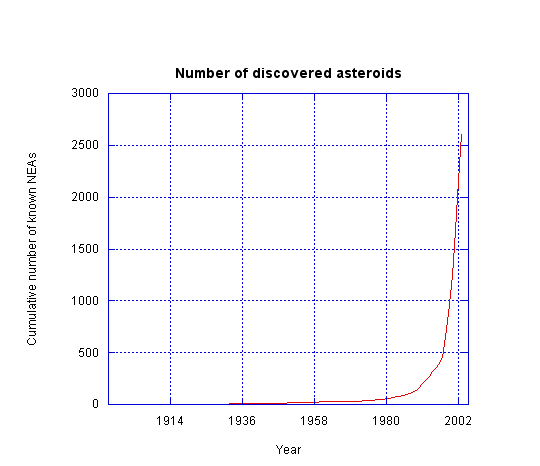
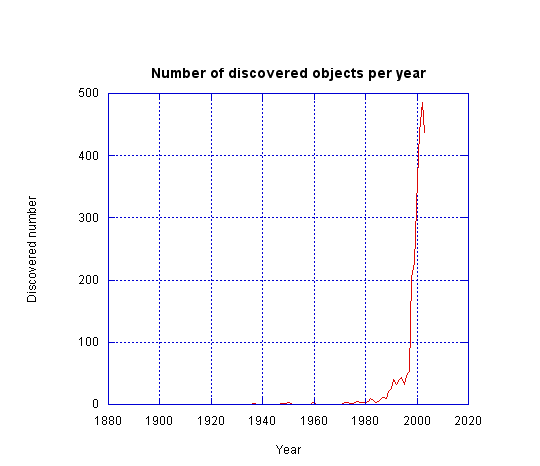
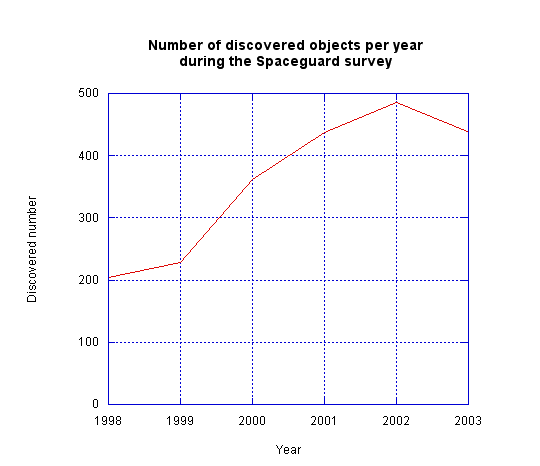
This evolution has been mainly driven by the number of active search telescopes. It is apparently also affected by the meteorological conditions (good years, bad years...). It is very difficult to establish a model for the efficiency of search telescopes. The same telescope, used in a different manner (exposing more time to get deeper for example) would not discover the same number and the same brightness class of objects.
The randomness of early discoveries shows the fact that nobody was looking for these objects. Then came the Shoemaker and Helin times starting in the early seventies at Palomar with discoveries becoming more frequent. After 1989, while the Palomar programs were still going on, Spacewatch started to discover a few faint objects, then LINEAR and NEAT came in action and the discovery rate exploded. It will be interesting to see the same diagram in a few more years.
The fact that less objects have been discovered this year is caused by the fact that 3 out of the 5 surveys stopped operation during some months of this year to upgrade their systems (NEAT, Spacewatch and Catalina).
Catalina observed only during November and December. Spacewatch and NEAT didn't produce much during the middle of the year.
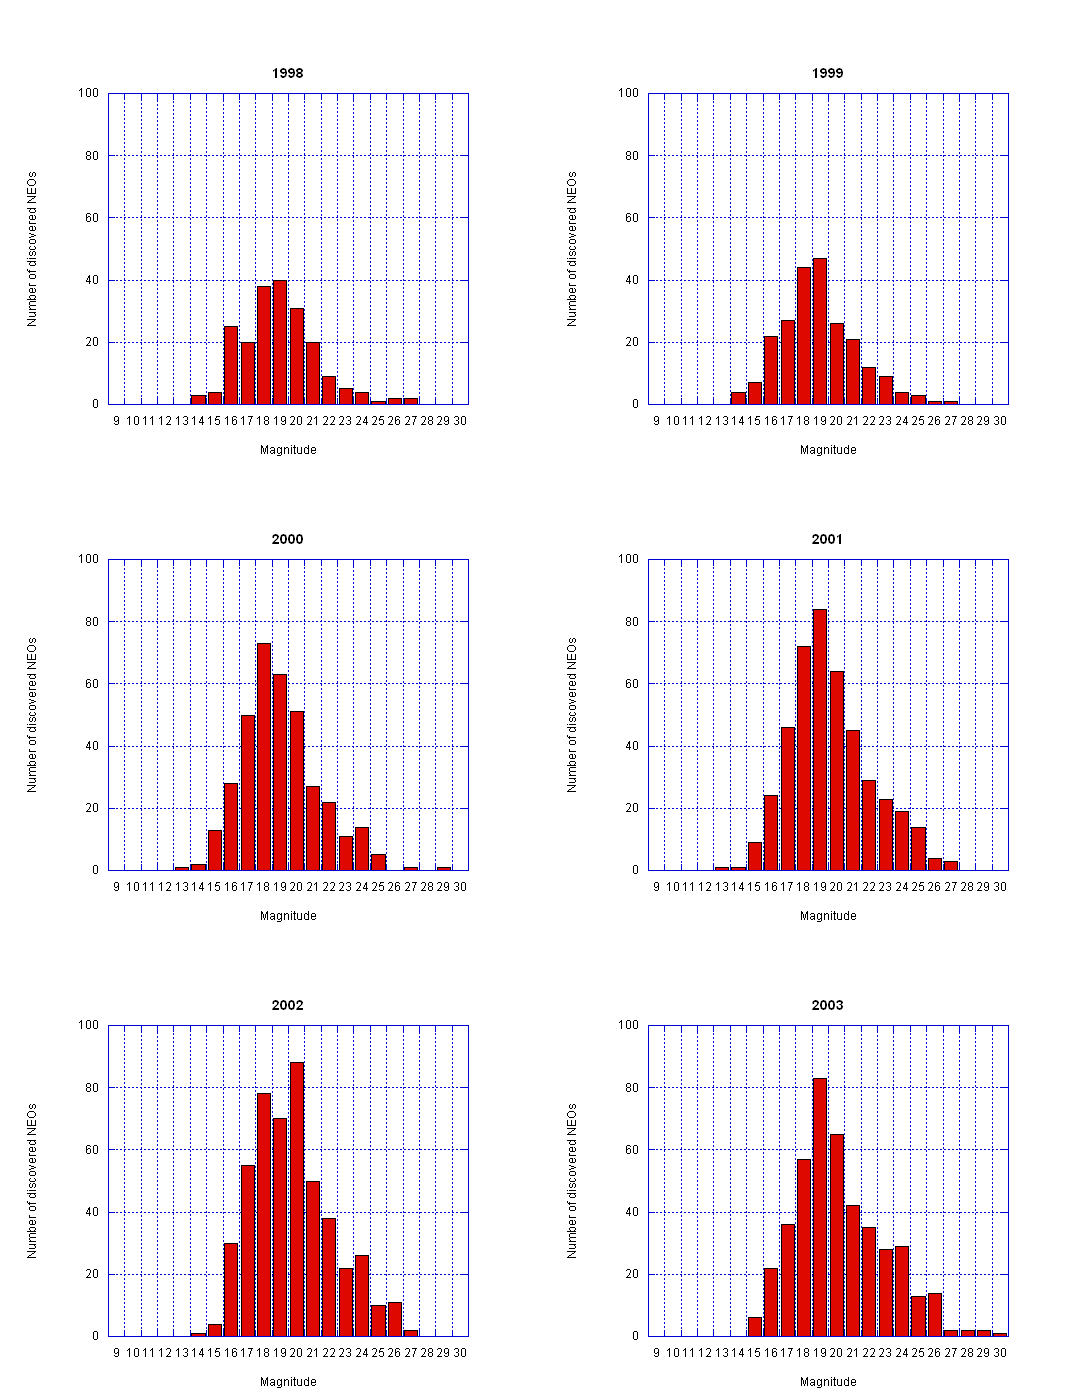
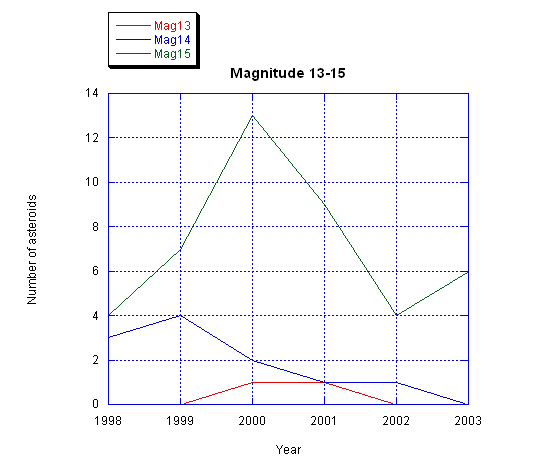
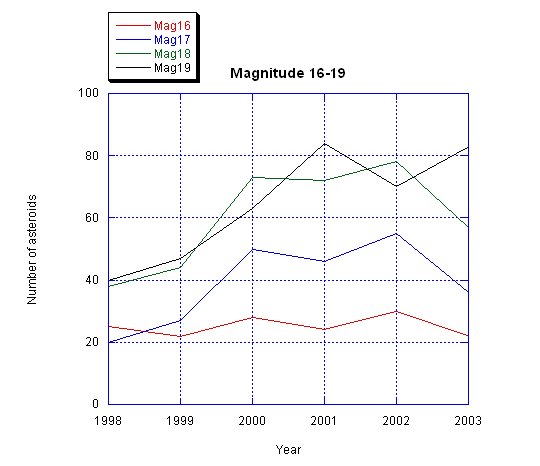
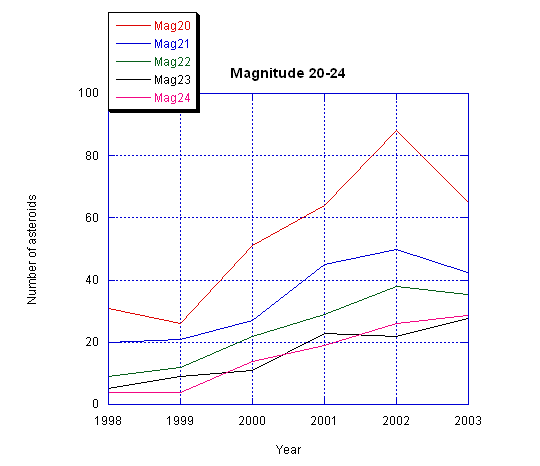
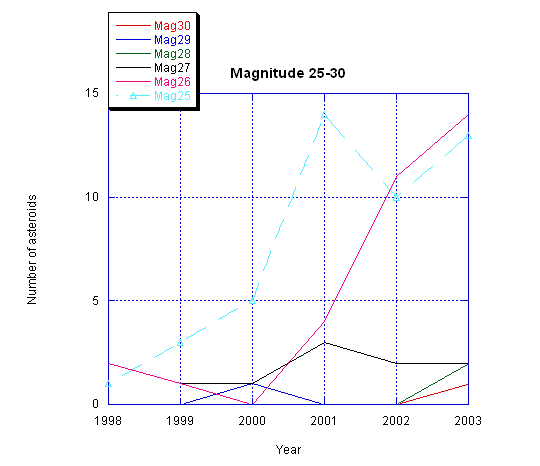
Here is in detail the evolution of discoveries since the beginning of the spaceguard survey per magnitude class:
There are only 3 NEOs brighter than absolute magnitude 13 (Ganymede, Eric and Eros), all discovered before the beggining of the Spaceguard Survey.
Asteroids 20826 (2000 UV13) and 25916 (2001 CP44) are the magnitude 13 objects discovered since the beginning of the survey. No other objects as bright have been found since.
The number of magnitude 14 objects (i.e. between 14.0 and 14.99) found every year is decreasing to about one a year. None were found this year. The number of objects of magnitude 15 is small too, causing random variations in the discovery rate. 5 were found in 2002, 6 in 2003, this despite the fact that 2003 was a year with less discoveries than the last 2 years.
It will be interesting to see how the magnitude 15 object discovery rate will behave. It is likely that the current trend will continue and that in a few year it will go down to one or zero per year. The same should then happen to the magnitude 16, and 17, then the Spaceguard survey goal will have been reached. (in this page, magnitude 17 objects are from 17.00 to 17.99, i.e. objects brighter than magnitude 18).
The curves of magnitude 16, 17 and 18 are almost parallel. It is interesting to note that there is no clear decrease of discoveries of bright objects. In fact, finding more magnitude 15 objects this year than last prooves that we are not yet reaching completion at this magnitude level. The cumulated number of objects brighter than magnitude 18 (noted magnitude 17 here) is 655 at the end of 2003, which is reaching quite close from the lower published estimates of certain groups (700). They are already proven wrong.
Same tendencies as above, apart from the number of objects which overall is smaller.
The small number of objects causes some random fluctuations from years to years.
Out of 65 objects magnitude 26 and fainter, 36 have been discovered by Spacewatch which is the only program currently going to apparent magnitude 21 and deeper. 23 of these fainter objects have been discovered by LINEAR.. This year was the first year that a magnitude 30 object was discovered.
This concludes this brief update of last year's web page. I wish I had more time to elaborate more. I would have loved to terminated a study I started about the precision of a 10 day arc orbit (the type that both JPL Sentry and Pises NEODYS system have used to post potential impact solutions), I would have loved to elaborate a little bit more on the theme of published magnitude, or how to cheat by not reporting correctly the wavelength band of observations. I can only stress the first numbers given in the first paragraph of this page : Why is the rest of the world, and mainly many other rich countries not doing anything about this potential problem.
Keep up the good work Spaceguarders !
